
Dividends: Should You Reinvest Them?
By Associate Portfolio Managers Mike Fiorese and Dan Sharkey, CFA
To reinvest, or not to reinvest, that is the question. Dividends and distributions from a portfolio are a welcome benefit of investing. Yet, when a cut of a company’s profits or interest from a bond is paid, investors are faced with a decision; reinvest the sum back into their portfolio or take the cash.
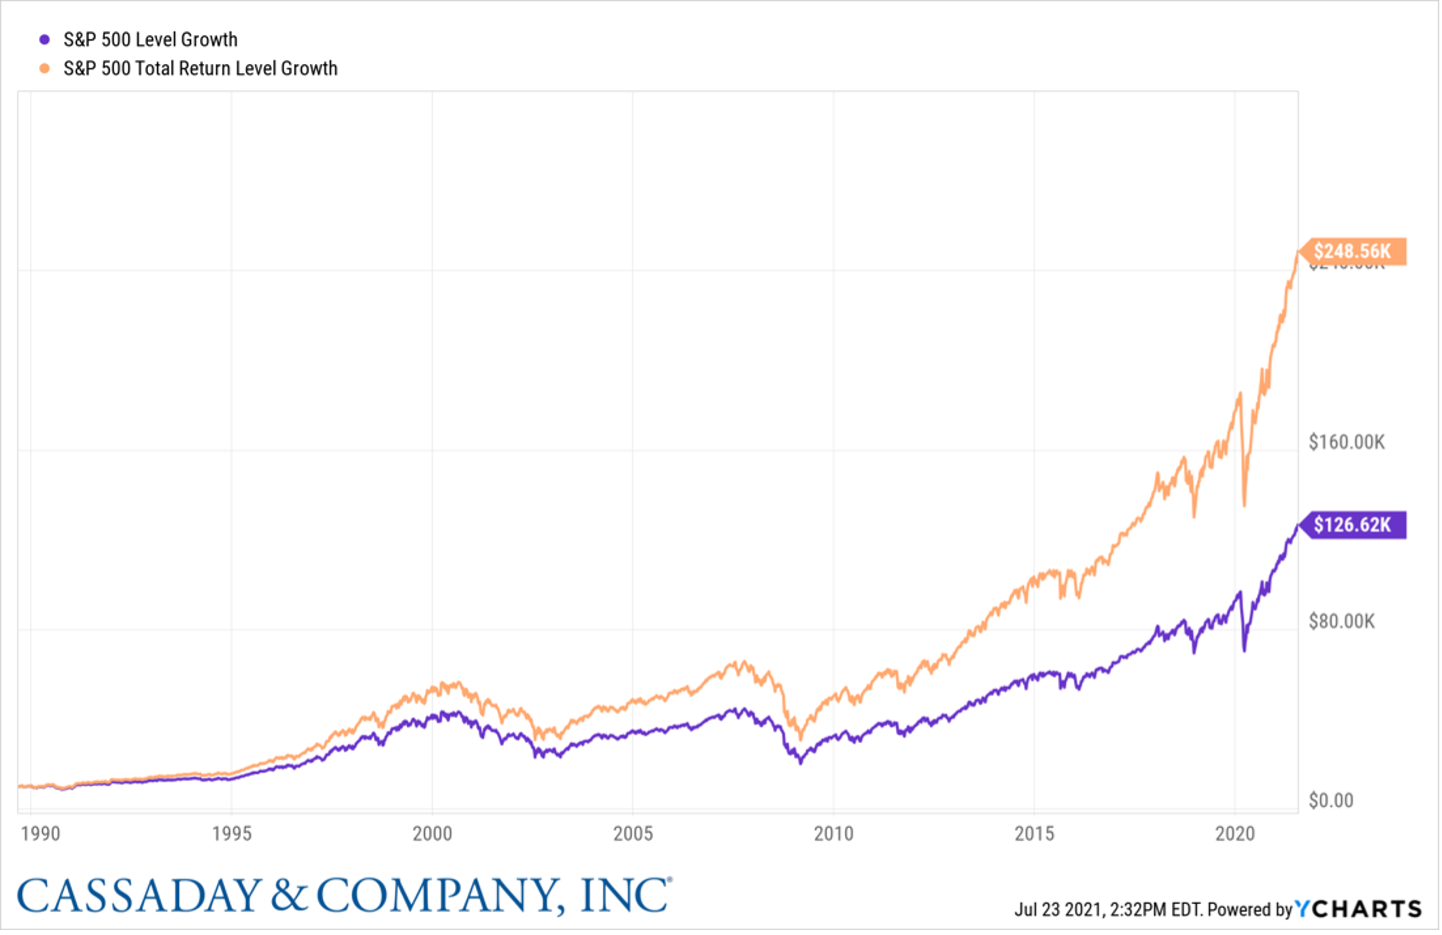
For investors not using distributions as a source of income from their accounts, the answer is straight forward, as seen in Figure 1. Reinvesting dividends back into the S&P 500 (orange line) outpaces the S&P 500 (purple line) excluding the effects of dividends and capital gain distributions. From 05/31/1991 to 05/31/2021, $10k invested in the S&P 500 would have grown to over $100k. The ending value nearly doubles if dividends were reinvested.
For individuals, especially retirees, relying on their investment portfolio for income, this decision becomes even more pertinent. At Cassaday & Company, Inc., we believe there is more than one way to add value for our clients. Making wise investment selections is one, but account management, specifically how the investments are operated, is another.
If an investor is taking regular distributions from their account, does reinvesting dividends still make sense? Or would allowing the distributions to accumulate into a pool of cash to be disbursed be the better option?
Our dedicated, in-house Research team studied the impacts of both options on a diversified portfolio, examining a multitude of results including (but not limited to):
- Performance differences
- Consistency of returns
- Isolated market environments (bull/bear/rallies/declines)
- Number of transactions
- Transaction costs
- Risk
The following asset class targets were employed to represent a diversified portfolio of moderate risk in the study:
- 66.5% Equities (US & Foreign)
- 27% Fixed Income
- 6% Alternatives
- 0.5% Cash
Variable factors tested included:
- Frequency
- Time period
- Vehicle type
- Withdrawal rate
It is important to note that asset class weight deviations caused by market movement were rebalanced back to target weights on a quarterly basis only if a deviation greater than 3% was present. Additionally, we define reinvestment where dividends are paid out and immediately reinvested into the same security. Dividends to cash is defined as distributions are accumulated in cash to meet the income requirement. Once the income requirement, or withdrawal rate, is met, any residual cash is reinvested proportionately back into the portfolio. Finally, a portfolio beginning value of $1 million and withdrawal rates of 0% to 5% were used in each test.
Test 1
- Portfolio holdings: Mostly mutual funds with some ETFs
- Start Date: January 1st, 2012
- Distribution frequencies: Monthly, quarterly, and annually
The first portfolio tested contained mostly mutual funds with some ETFs. Portfolios were constructed to mimic the variation found in many investors’ portfolios with differing distribution frequency, a range of transaction costs, etc. The portfolio was constructed using funds that we have held in the past. January 1st, 2012, was used as the start date since some funds were incepted in 2011.
Results: 5 out of 6 withdrawal rates tested had a higher end value when dividends were reinvested.
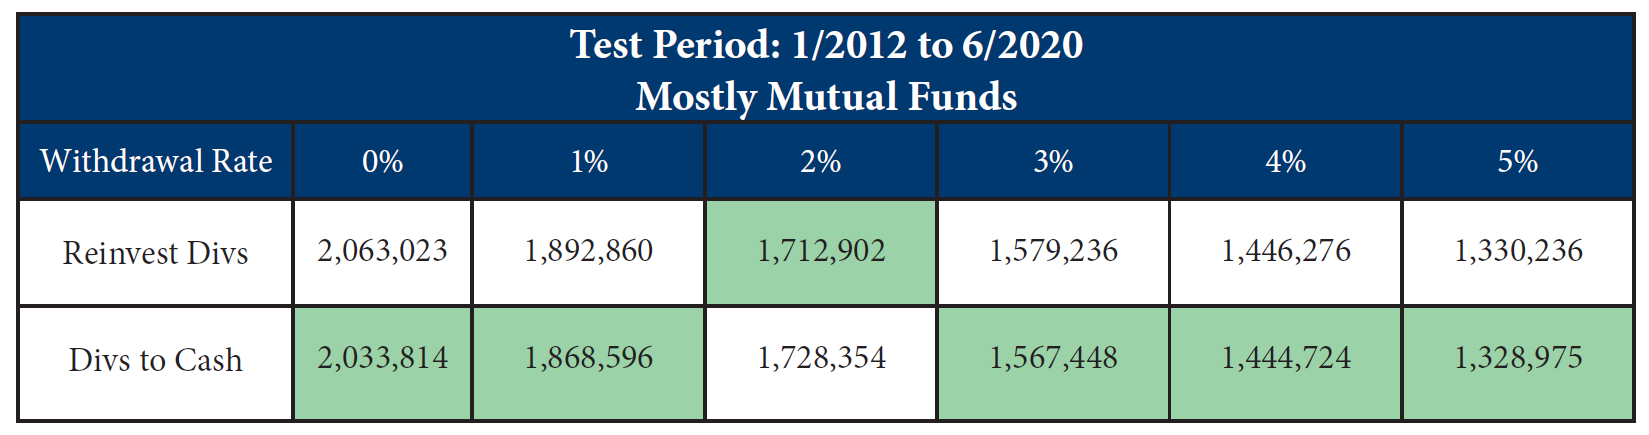 Source: Cassaday & Company, Inc., FactSet
The Outlier
The outlier in the test was at the 2% withdrawal rate. Upon closer evaluation we found that this occurred due to the equity market downturn at the end of 2018. The cash dividend strategy had built up significant cash to fund previous distributions, so no fund sales were required in previous quarters. The equities were over 3% overweight, and the portfolio was rebalanced at the end of the third quarter. Then, after the fourth quarter pullback, the portfolio required rebalancing due to equities being over 3% underweight. The cash strategy sold high and bought low at the perfect time by coincidence.
Test 2
- Portfolio holdings: Mostly ETFs with some mutual funds
- Start Date: January 1st, 2012
- Distribution frequencies: Monthly, quarterly, and semiannually
Passively managed ETFs buy and sell individual securities infrequently, therefore capital gains distributions are rare. Additionally, dividend distributions tend to be more frequent. The second portfolio tested contained mostly ETFs to see if the differences in distribution size and frequency would change the outcome.
Results: 4 out of 6 withdrawal rates tested had a higher end value when dividends were reinvested.
Since ETFs do not tend to have large year-end capital gains distributions like some mutual funds, the differences in market values for the two strategies were smaller. Therefore, the timing of rebalances and resulting target weight deviations preceding large market moves enabled the cash dividend strategy to outperform the reinvesting strategy in the 2% and 5% withdrawal test rate tests.
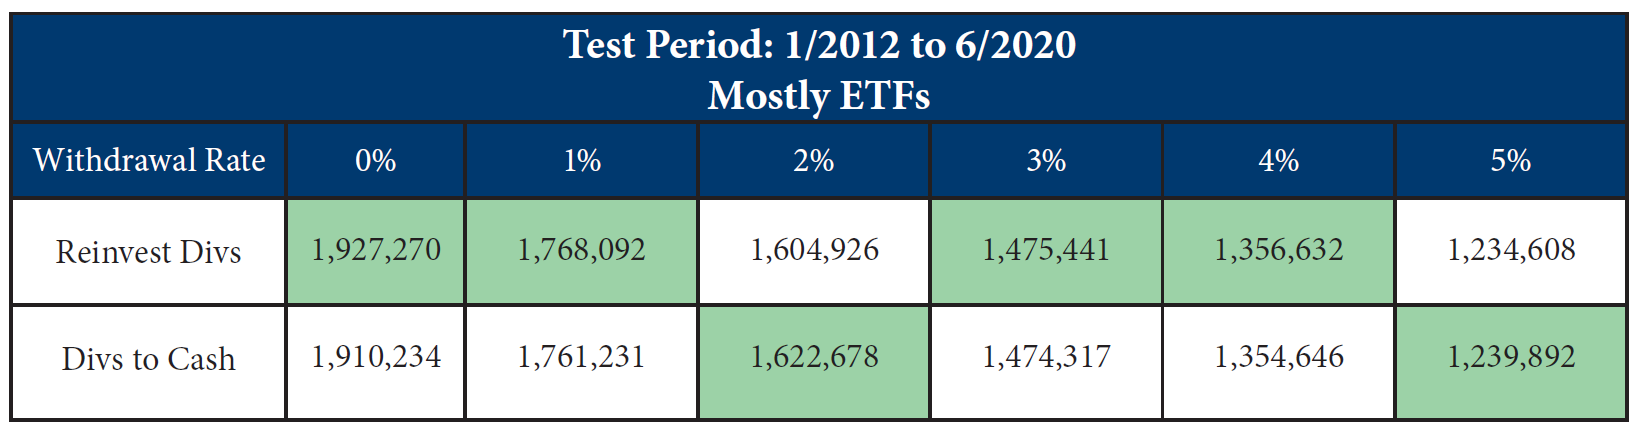 Source: Cassaday & Company, Inc., FactSet
Test 3
- Portfolio holdings: Mostly mutual funds with some ETFs
- Start Date: January 1, 1999
- Distribution frequencies: Monthly, quarterly, and annually
In this test, we restructured the products in the portfolio to test the impact of dividends over a longer period, allowing us to look at full market cycles. Our goal was to test the effects of dividends in bull and bear markets over an extended period of time. A blend of mutual funds and passively managed ETFs were used in this test and the target allocation weights remained consistent with what was previously stated.
Results: 5 out of 6 withdrawal rates tested had a higher end value when dividends were reinvested.
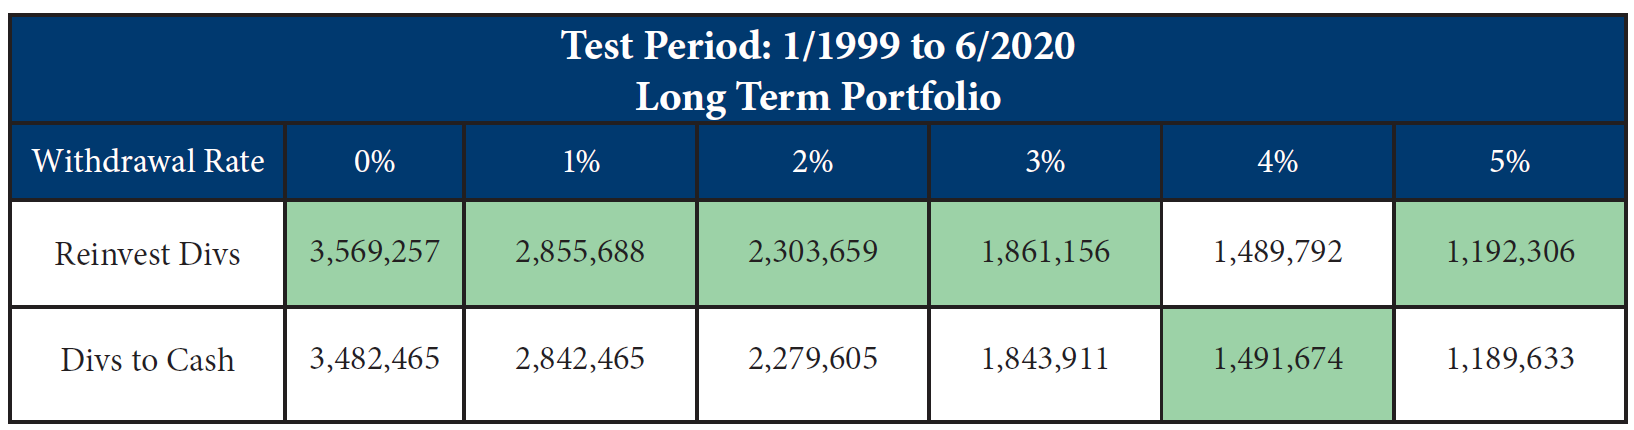 Source: Cassaday & Company, Inc., FactSet
This begs the question, why didn’t reinvesting dividends have a clean sweep? When and why did the market values switch in the 4% withdrawal test?
After looking at the underlying data, the advantage of taking dividends in cash occurred in Q3 2011 when broader equities were down -15%. The portfolio received $6,000 in dividends, more than half the required quarterly distribution for the account to satisfy the 4% annual withdrawal rate. Less cash needed to be raised from the portfolio, therefore assets that were down significantly did not need to be sold at their lows, as a result “Divs to Cash” outperformed “Reinvest Divs” by 24 basis points. “Divs to Cash” kept the market value lead from that point through the end of the study.
One would think that the 5% withdrawal rate would follow the same outcome as 4%. It did not. Comparing the 5% withdrawal study, “Reinvest Divs” had a much larger lead going into Q3 2011 and continued to be the leader following that quarter and through the end of the study.
Conclusion
There is not a one-size-fits-all strategy for a diversified portfolio taking periodic withdrawals, but one thing is clear: overwhelmingly, our study shows that reinvesting dividends results in a higher portfolio value. Ultimately, it is important to consider the many factors that can impact the results of the analysis:
- Investment Type
- Equities, Bonds, Alternatives
- Mutual Funds, ETF’s, Stocks, Bonds, etc.
- Dividend Payout Frequency
- Monthly, Quarterly, Annually
- Market Environment
- Bull or Bear Market
- Portfolio Withdrawal Amount
- Percent of Total Account
- Withdrawal Frequency
- Monthly, Quarterly, Annual Distributions
- Rebalancing
- Account Deviation Tolerance
- Rebalance Frequency
The effects of dividends on your portfolio will vary based on the factors listed above. For Cassaday & Company, Inc., clients, we believe a well thought out approach to maximize investment returns is essential to the account management aspect in our industry.
###
All opinions expressed in this article are for general informational purposes and constitute the judgment of the author(s) as of the date of the report. These opinions are subject to change without notice and are not intended to provide specific advice or recommendations for any individual or on any specific security. The material has been gathered from sources believed to be reliable, however Cassaday & Co. cannot guarantee the accuracy or completeness of such information, and certain information presented here may have been condensed or summarized from its original source. Cassaday & Co. does not provide tax or accounting advice, and nothing contained in these materials should be taken as such. To determine which investments may be appropriate for you, consult your financial advisor prior to investing. As always please remember investing involves risk and possible loss of principal capital and past performance does not guarantee future returns; please seek advice from a licensed professional.
Cassaday & Company, Inc. is a Registered Investment Adviser. SEC Registration does not constitute an endorsement of Cassaday & Co. by the SEC nor does it indicate that Cassaday & Co. has attained a particular level of skill or ability. Advisory services are only offered to clients or prospective clients where Cassaday & Co. and its representatives are properly licensed or exempt from licensure. No advice may be rendered by Cassaday & Co. unless a client service agreement is in place.
This article uses hypothetical back-tested performance data. The performance results represent the hypothetical back-tested model results of a diversified portfolio with moderate risk, and do not reflect actual trading by Cassaday & Company, Inc. and do not represent the actual performance achieved by any Cassaday & Company, Inc. clients. For more information on hypothetical performance data and its limitations we encourage you to read these Important Disclosures.
Related Posts


